
-- Start of StatCounter Code for Yahoo! Site Builder
(Windows) -->


| Real time trade alerts made in OUR VERY OWN ACCOUNTS sent to you in REAL TIME with daily updated technical charts & trading plans issued DAILY to members |
USING THE (RSI) RELATIVE STRENGTH INDICATOR
Determining & forecasting future price fluctuations by gauging the internal market strength
APRIL 11, 2013 3.13 PM - New York NY
Relative Strength Index (RSI)
Definition:
Relative Strength Index (RSI), an oscillator introduced by J. Welles Wilder, Jr., could be more
appropriately called the internal strength index, for it compares the price of a security relative
to itself. The RSI is based upon the difference between the average of the closing price on up
days vs. the average closing price on the down days over a given period, and is plotted on a
vertical scale of 0 to 100. An oscillator refers to a momentum or rate-of-change indicator that
is usually valued from -1 to +1 or 0% to %100.
Wilder advocated a 14-day RSI, although shorter and longer periods have gained popularity
when the market exhibits certain characteristics. Generally, RSI is measured in a period
between 5 and 25.
RSI is a value calculated with the following equation:
1
______
1 + U/D
Where U is the average of upward movement and D is the average of downward movement. RSI Classic uses this calculation.
There are two formulaic differences between RSI Classic and RSI (our original method of displaying this indicator).
Whereas RSI classic creates U by (total upward movement/number of up days) and creates D by (total upward movement/number of down days), IQ Chart's formula creates U by (total
upward movement) and D by (total downward movment).
RSI Classic uses an exponential moving average of (AvgGain/AvgLoss) where AvgGain = total gain in n periods. N is the rsi period.
Interpretation:
There are several possible interpretations for the Relative Strength Index, any of which can be very powerful depending on the market conditions and trading/investment approach:
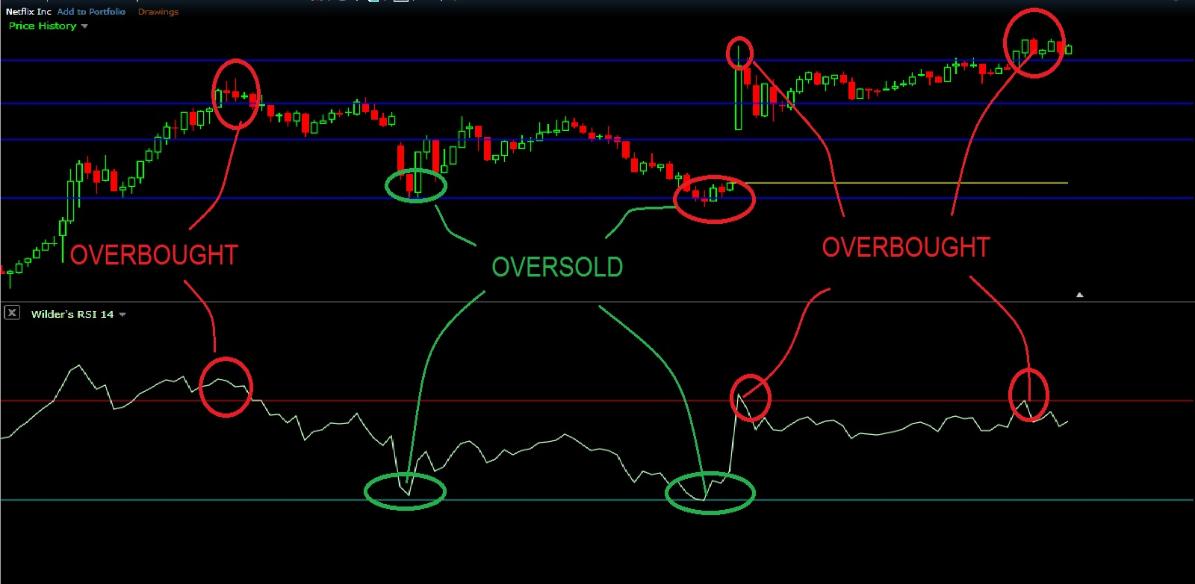
One interpretation is that buy signals are triggered when RSI is in oversold (20-30) area, potentially meaning that the stock is about to reach its low for this trend, and sell signals are
triggered when RSI is in overbought (70-80) area, potentially signaling a market top. No one indicator will confirm price, we also like the stochastics combined with OBV
A second mode of interpretation we like to look for support and resistance lines or common chart formations such as head and shoulders in the RSI itself, indicating potential reversals
that the stock chart may not. During seasonal volatility saavy investors, hedge funds & Financial advisors use these pros for market timing analysis
A third mode of interpretation is to recognize divergences in the RSI, such as when the price is moving up when the RSI is moving down or vice versa. This can mean that the price is
going to "correct" and move in the direction of the RSI. - Using our Stock screening Checklist will produce winner after winner.
A fourth mode of interpretation for the RSI is to view it as a bullish or bearish signal when it crosses 50. When the RSI crosses above 50 it can be considered bullish, and when it
crosses below 50 it can be considered bearish. Read more on how we use the ADX Indicator & bollinger bands to determine future stock price movement
There are two formulaic differences between RSI Classic and RSI (our original method of displaying this indicator).
Whereas RSI classic creates U by (total upward movement/number of up days) and creates D by (total upward movement/number of down days), IQ Chart's formula creates U by (total
upward movement) and D by (total downward movment).
RSI Classic uses an exponential moving average of (AvgGain/AvgLoss) where AvgGain = total gain in n periods. N is the rsi period.
Interpretation:
There are several possible interpretations for the Relative Strength Index, any of which can be very powerful depending on the market conditions and trading/investment approach:
One interpretation is that buy signals are triggered when RSI is in oversold (20-30) area, potentially meaning that the stock is about to reach its low for this trend, and sell signals are
triggered when RSI is in overbought (70-80) area, potentially signaling a market top. No one indicator will confirm price, we also like the stochastics combined with OBV
A second mode of interpretation we like to look for support and resistance lines or common chart formations such as head and shoulders in the RSI itself, indicating potential reversals
that the stock chart may not. During seasonal volatility saavy investors, hedge funds & Financial advisors use these pros for market timing analysis
A third mode of interpretation is to recognize divergences in the RSI, such as when the price is moving up when the RSI is moving down or vice versa. This can mean that the price is
going to "correct" and move in the direction of the RSI. - Using our Stock screening Checklist will produce winner after winner.
A fourth mode of interpretation for the RSI is to view it as a bullish or bearish signal when it crosses 50. When the RSI crosses above 50 it can be considered bullish, and when it
crosses below 50 it can be considered bearish. Read more on how we use the ADX Indicator & bollinger bands to determine future stock price movement