
-- Start of StatCounter Code for Yahoo! Site Builder
(Windows) -->


Real time trade alerts made in OUR VERY OWN ACCOUNTS sent to you in REAL TIME with daily updated technical charts & trading plans issued DAILY to members
| FIBONACCI 101 - RULES OF ENGAGEMENT |
May 03, 2013 3.43 PM - New York NY 10001
Many people ask me if Fibonacci retracements and extensions really work when it comes to
trading, and to the that I have the following answers. First off all I would recomend that you
go and read my article on How to use Fibonacci Then come back here and we’ll discuss this
further. I think everyone knows that price moves in a retracement type fashion in any
direction accept when it’s trading in a range bound channel. If price is going up, it tends to
do so in a series of what we call impulse’s and corrections..
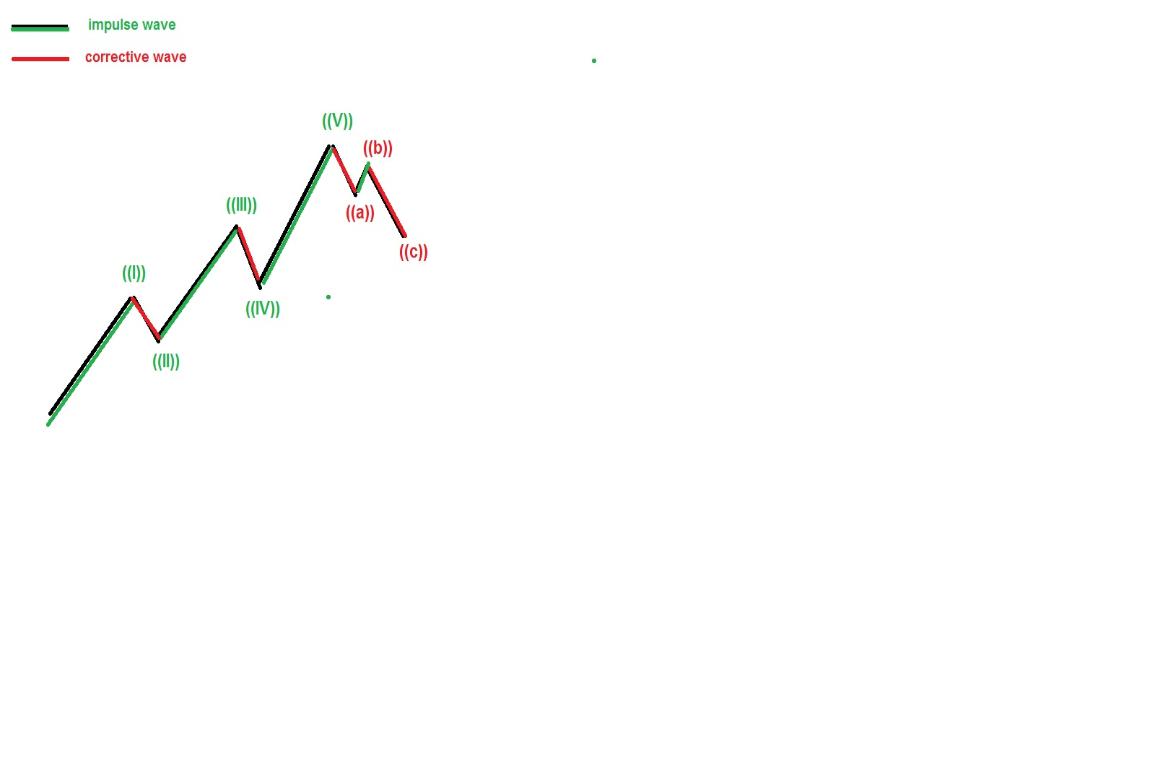
Introducing Technical Analysis 101 - Fibonacci Indicators by DayTradersGroup.com
There are many different scenarios this particular pattern could be apart of, but the
potential for the application of Fibonacci retracements and extensions lies in not only this 5
wave move up, but also and especially in the overall correction of this move. You see
although this is 3 impulse waves, and 2 corrective waves, on the larger scale its one
impulse wave.
Here’s what I mean:
Many people ask me if Fibonacci retracements and extensions really work when it comes to
trading, and to the that I have the following answers. First off all I would recomend that you
go and read my article on How to use Fibonacci Then come back here and we’ll discuss this
further. I think everyone knows that price moves in a retracement type fashion in any
direction accept when it’s trading in a range bound channel. If price is going up, it tends to
do so in a series of what we call impulse’s and corrections..
Introducing Technical Analysis 101 - Fibonacci Indicators by DayTradersGroup.com
There are many different scenarios this particular pattern could be apart of, but the
potential for the application of Fibonacci retracements and extensions lies in not only this 5
wave move up, but also and especially in the overall correction of this move. You see
although this is 3 impulse waves, and 2 corrective waves, on the larger scale its one
impulse wave.
Here’s what I mean:

Notice the corrective wave in red – (Fibonacci retracements in action – larger scale)
5 Rules of Engagement to MASTER Fibonacci Chart Plotting
Fibonacci retracements represent an excellent tool for investors, identifying potential reversal points on a
price chart. Anyone can see that on any historical price chart, trading prices will inherently pull back or
retrace a percentage of the previous movement before reversing again and then proceeding in the
direction of the overall long-term trend.
Historical observations demonstrate that these Fibonacci retracements seem to follow a Fibonacci ratio
pattern. By carefully plotting these retracement possibilities on a historical price chart, a trader improves
his or her probability towards successful investing. Certain rules are recommended to improve the
likelihood of identifying successful entry and exit points.
First Rule of Engagement : Identify the High and Low
In order to use Fibonacci retracements the right way, it is important to identify relative high and low prices
on a historical chart. The longer the term that is utilized, the more likely the Fibonacci retracements plotted
will identify significant levels demonstrated support and resistance.
Rules of Engagement 2: Plotting the Fibonacci Retracements
Once a high and low for a time period has been identified, you lay out your Fibonacci retracements. The
low point would represent 0%, and the high point represents 100%. (A good rule of thumb with Fibonacci
retracements is to make sure that as price retraces, the levels are getting higher – ie; 23.6%, 50%. 61.8%
etc… Rather than lower. If they are getting lower you laid them down the wrong way.)
Between these two extremes, one can plot the most significant Fibonacci percentage plot lines of 38.2%, 50%, and 61.8%. It is also beneficial to plot these percentages below and
above the high and low. In other words, plot lines that would be 138.2%, 150%, and 200% on the up side above the high, and -30.2%, -50%, and -61.8% on the down side below the
low. It should be noted that software exists that will allow you to automatically plot these Fibonacci retracements. (most platforms have the tools ready to go.)
Rules of Engagement 3: Observe Historical Behavior
Once the plot lines have been placed on the chart, it is important to observe at which Fibonacci levels in the historical period under consideration has demonstrated support and
resistance. These areas will be objectively seen to show that when approached, retracement clearly resulted.
Rules of Engagement 4: Forecasting Future Movement
The appropriate Fibonacci retracements will vary from investment market to investment market and be a function also of the trading character at any particular time. Consequently,
successful use of Fibonacci techniques will be highly dependent on the accurate interpretation of previous price movement activity within the range identified. When the proper
Fibonacci retracements have been observed, entry and exit points can be forecasted for position-taking based upon the clearly demonstrated historical record.
Rules of Engagement 5: Always Have Confirmation
Through study and observation, many successful traders have mastered the techniques necessary for the use of Fibonacci retracement ratios. As anyone can see, however, the
support and resistance represented by these levels do not automatically appear at all times. In other words, after the 38.2% retracement, the price may continue in that direction and
not stop or reverse itself until perhaps it reaches 61.8%.
What is clear, however, at a certain Fibonacci point, a retracement will occur. As a result of this, the use of Fibonacci techniques is most successful when used in conjunction with
other technical analysis tools that confirm what has been identified.
More Fibonacci Retracements
The Fibonacci Retracement is probably the most heavily used Fibonacci tool in the toolset. You will find Fibonacci Retracements as a solid tool in identifying key support and
resistance areas.
If prices have fallen from a recent swing high down to a swing low, the expectation is that price should retrace distance, high to low, by a ratio of the Fibonacci sequence. .
You can use Fibonacci retracements and extension from a tick chart through a daily, monthly and weekly. Literally any time frame
It is important to note, the larger price move from swing high to swing low, the more accurate the retracement projections. Identification and selection of the correct swing points are
keys to success.
While there are many variations of the ratio set, simple is better, lets focus on four major retracement levels.
23.6% — The shallowest of the retracements. In very strong trending markets price typically quickly bounces in the area of this ratio.
38.2% — This is the first line of defense of the current trend. Breaking this level starts to erode the underlying trend.
50% — The neutral point of any retracement. This is the critical tipping point.
61.8% — retracing to this typically signals a breakdown in the trend.
100% — Matching the move
Fibonacci Retracements are the cornerstone of Fibonacci theory as it applies to the financial markets. Hopefully these examples have provided guidance from which to draw your own
retracements and expand your trading toolset. To recap, while there are other retracement values, my defaults Fibonacci Retracements always include:
23.6% 100%
38.2% 138.2%
50% 161.8%
61.8% 200%
You can never tell when price action it going blow well beyond the 100% level.- a great example of profiting using Fibonacci can be seen here, an 800% profit in 24 hours, yesterday
I use this set of retracements on a daily basis, from 23.6% all the way to 200% and sometimes 300% For my style of trading I find 38.2%, 50% and 61.8% quite reliable.I use the other
primarily as confirmation levels.
To profit daily from Fibonacci join us in our trading room for retailed predetermined trading plans posted daily to members of our trading group, sign up today
DayTraders Group of America all rights reserved