


April 4, 2013 - New York, NY 5:38 pm
RE: SPY S&P 500 ($155.23)
You wonder how long this rally can last? So do I.
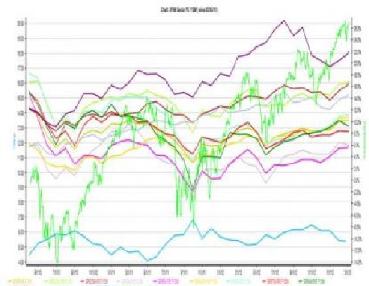
To get a little more serious, Let's took a deeper dive on that subject. The chart to the right shows
the Forward 12-Month Price to Earnings or P/E ratio for each of the ten S&P 500 sectors, plus the
S&P 500 index composite price. A ZRS equity risk premium over the last three years is in blue,
running along the bottom of the chart.
RE: SPY S&P 500 ($155.23)
You wonder how long this rally can last? So do I.
To get a little more serious, Let's took a deeper dive on that subject. The chart to the right shows
the Forward 12-Month Price to Earnings or P/E ratio for each of the ten S&P 500 sectors, plus the
S&P 500 index composite price. A ZRS equity risk premium over the last three years is in blue,
running along the bottom of the chart.
The Yellow line at around a 14 forward 12-month P/E ratio is the S&P 500 composite. The Purple line is Telco's forward P/E at the top, now
around 18. At bottom, Energy and Financials forward P/E is in Pink and light Grey around 12.
Conclusions?
Look at the S&P 500 Index in bright green, the equity risk premium in light blue at the bottom, and the tilt up and down in sector P/E valuations
over the last three years.
Notice anything? I do.
The equity risk premium peaks at S&P 500 bottoms, and stock valuations tilt up from bottoms. That makes perfect sense.
The Equity Risk Premium moved from just over 6% four months ago, to about 5.3% now. Macro event risk reduction is the core driver of stocks
in the latest rally, much like the last two rallies. Note: ERP used the AAA corporate bond rate at 3.9% for its risk-free rate, not a risk-free
Treasury rate.
So why care?
Because if you look, we saw a six-month rally in 2010 after the first bout of the Euro crisis, a six-month rally again in 2011 after a second bout
caused by Greece and Spain, and now one "Fiscal Cliff" recovery starting in November.
The previous two rallies went six months. We are in this one four months. That means to me that we may have two months of this rally to go.
Sell in May and go away?
Seasonality : We are rapidly approaching the well-known "sell in May and go away," as developed by the StockTraders Almanac. This
well-documented approach indicates that most of the gains in the stock market occur between October and May with the "worst six months" just
ahead generating down or flat returns.
Technical : The chart above illustrates the current divergence in global stock markets. The Shanghai Composite Index, the German DAX index
and the Vanguard MSCI Europe ETF are all converging in declining patterns, while the S&P 500 continues climbing to record highs.
Divergences like these are generally resolved one way or the other, so either the rest of the world's financial markets need to improve or the
S&P 500 could be set to decline.
How to protect your nest egg
For the next 6 months you may want to consider hiring a Professional Trade Alert Service to help you navigate though the years most turbulent
season. The worlds largest hedge funds utilize these services on a daily basis year round.
History doesn't necessarily repeat, but it often rhymes, and this time is no different. With the current combination of fundamental, contrarian,
seasonal and technical factors in play, Wall Street Sector Selector has gone to "Red Flag" status for Europe and remains in "Yellow Flag
Status" for the United States, expecting the possibility of a big correction dead ahead.